Key Points
- 69% of 2022 quantitative political science articles shared no data or code.
- A 2026 poll found 81% of social scientists had tried AI chatbots.
- R and Stata dominate applied work; Python leads for machine learning.
Introduction: Why Quantitative Skills Travel Well into Social Science
AI tools now handle much routine modeling, and the debate has shifted to what methods training is still for. In a recent r/GradSchool thread, an applied math PhD student asked whether the doctorate had become "a longer masters program." A well-received reply called AI "a force multiplier" and described mathematicians who can speak to non-mathematicians as "very rare and desirable."
Social science tests that translation hardest. Its questions are causal, its data are incomplete, and its subjects change behavior when studied. A clean regression can still answer the wrong question about a housing voucher or a reentry program.
The value now sits in choosing the right method, not merely running it.
A Beginner-to-Advanced Methods Pathway, from Descriptive Stats to Causal Inference
You can learn methods in the order courses teach them, or in the order your research questions demand. The strongest path blends both. U.S. graduate practice generally puts causal inference after core econometrics, so difference-in-differences, instrumental variables, and regression discontinuity are rarely first-semester techniques.
The Learning Ladder
A workable sequence runs from descriptive statistics and data cleaning, to linear and logistic regression, to the potential-outcomes framing of causality. From there come quasi-experimental designs (difference-in-differences, instrumental variables, regression discontinuity, matching), then longitudinal and panel models, multilevel models, and finally network and text methods. Course catalogs vary on the internal order. Some programs introduce difference-in-differences right after fixed effects, while others begin with matching because it makes selection on observables explicit. Harvard's 2026 causal inference course, for example, expects calculus, introductory probability and statistics, and familiarity with linear regression.
What Causal Inference Actually Means
It is not a fancier regression. It is a way of defining a counterfactual (what would have happened without the treatment) and then stating the assumptions that let you estimate it. Those assumptions are part of the analysis, not a footnote:
- Matching and propensity scores: selection only on observables, plus overlap. Unmeasured confounding remains unsolved.2
- Difference-in-differences: parallel trends. Pre-period plots support plausibility but cannot prove the post-treatment counterfactual, and staggered adoption can complicate two-way fixed effects.3
- Instrumental variables: relevance and the exclusion restriction, yielding an effect for compliers.4
- Regression discontinuity: continuity at the cutoff, with an effect that is local to that cutoff.3
Picking a Design
Ask what the treatment is and when it began. Then ask how assignment worked. A rule-based cutoff points to regression discontinuity. Rollout across units at different times suggests difference-in-differences. Assignment shaped by unobservables, with a plausible outside nudge, may call for an instrument. Choose the design the question permits, not the most prestigious one.
How Much Math You Need
Calculus, linear algebra, and probability through regression are the realistic floor. Matrix notation and asymptotic theory help, but understanding bias and confounding matters more. Basic R, Stata, or Python is expected in most advanced courses.5
One Portfolio Piece per Stage
Build a small, documented project at each stage: a cleaned descriptive report, a regression analysis, a matching study, a quasi-experimental replication, and so on. Each should state its assumptions plainly. Finished work shows learning in a way a CV skills list cannot.
- Econometrics and Causal Inference with R, Harvard University
- Causal Inference Slides, University of Michigan
- Causal Inference, Harvard University
- 2026 Northwestern Causal Inference Workshops, Columbia University Department of Economics
- Causal Inference Syllabus, University of Rochester
Did You Know?
Do not shop for a shiny method before you know what decision a policymaker or collaborator actually faces. A simple comparison with clean assumptions usually beats a sophisticated model with implausible ones. The practical test: can you explain in one sentence what would have happened without the intervention, and why your design can see it?
Choosing Software and Building Reproducible Workflows That Survive Peer Review
Software choice comes down to a tradeoff between the language you know best and the one your collaborators, field, and target journals already use. The second usually wins. A benchmark showing one language runs a model faster matters less than whether your co-author can open your script, rerun it, and check the coefficient in Table 2. Treat the language as a shared workspace, not a personal identity.
What Reproducible Means in Practice
Reproducible means your documented code and available inputs regenerate every number in the paper. It does not prove findings will replicate in a new sample. It proves the analysis can be inspected.
- Version control: Track changes with Git, hosted on GitHub or a similar service, and tag the version that matches each manuscript draft. Never commit confidential data, passwords, or identifying information.
- Literate documents: Quarto (which supports R, Python, and Jupyter) and Jupyter notebooks combine code, results, and explanation. Stable data transformations still belong in scripts.
- Frozen inputs: Leave raw data untouched. Record package versions with renv for R, or with requirements.txt or environment.yml for Python.
- Navigable folders: Separate raw data, processed data, code, notebooks, and manuscript. Add a README a stranger could follow from start to finish.
Norms That Mark Professional Work
Students often clean data interactively and paste tables into a draft. Professionals take a different approach:
- They write every cleaning decision into code.
- They never edit output by hand.
- They preregister confirmatory analyses when feasible, through OSF Registries, AsPredicted, or the AEA RCT Registry, labeling exploratory work and later amendments as such.
When you hand results to a social scientist co-author, send the script that produces the table rather than pasted output. Add a short plain-language note on what each estimate means so a non-technical colleague can verify the logic instead of simply trusting it.
Funders and Journals Now Expect It
Reproducibility has shifted from personal virtue to requirement.
- NIH: Most funded researchers have had to submit a data management and sharing plan since 2023.1 A new plan format applies to applications due on or after May 25, 2026.
- NSF: Revised data-sharing requirements cover new awards as of December 8, 2025, and the plan becomes an award condition.2
- IES: Data sharing plans have been required since fiscal year 2025.3
Journals commonly ask for data and code availability statements and a repository deposit. For archival release, use a repository that issues a DOI rather than GitHub alone. Restricted data can still be supported through controlled access or synthetic versions.
- Federal Public Access Policies, Stanford Libraries
- U.S. Code Title 42 §19053, U.S. House of Representatives
- Public Access Research, NCES
R, Python, Stata, and SPSS Side by Side
The right tool is usually the one your collaborators, advisor, or agency already uses. R and Stata dominate applied social science methods work, Python leads when a project involves machine learning or large-scale text, and SPSS remains common in agency and program-evaluation settings. Switching mid-project is costly, but skills transfer quickly, and employers rarely hire on tool name alone. Treat the adoption notes below as general tendencies, not fixed rules.
| Dimension | R | Python | Stata | SPSS |
|---|---|---|---|---|
| Cost and licensing | Free, open source | Free, open source | Student SE: $179 for one year or $485 perpetual (continues after graduation); annual MP4 license $995 (2026) | GradPack Base: $58 for one year, ends with enrollment; Base commercial license $1,308 per year (2026) |
| Learning curve | Steeper start, code-first, large community help | Gentle for general programming, more setup for statistics | Menus plus concise commands, often easiest for econometrics beginners | Menu-driven, quickest for point-and-click analysis |
| Causal and survey ecosystem | Broad package coverage for causal inference, survey weighting, and multilevel models | Strong for machine learning and text, growing causal toolkits | Built-in tools such as ivregress and stcox in the cheapest edition; strong panel, survival, and time-series work | Core procedures are menu-accessible, but some methods, such as Cox regression, need the Advanced Statistics add-on |
| Reproducibility and version control | Scripts and notebooks work well with Git | Scripts and notebooks work well with Git | A.do file with a log captures a rerunnable transcript | Paste button writes syntax, but using syntax is optional |
| Common settings | Academic research groups, public policy analytics | Data science teams, computational social science | Economics, public health, and applied social science | Agencies, program evaluation, and some social work settings |
- Stata | New in Stata, StataCorp
- SPSS vs Stata: Menu Paths, Commands & Real Prices, MetricGate
- Statistics Software for Universities: What It Costs, MetricGate
- Stata vs SPSS: One Cox Model, Run Both Ways, MetricGate
- Stata vs SPSS Statistics | Which Statistical Analysis ..., SelectHub
- Statistics Software for Graduate Programs, MetricGate
Data Sources, Missing Data, Sampling, and Ethics: The Practical Checklist
Most analytic mistakes in applied social science are made before the first model runs, in how data were obtained, cleaned, and understood. A short, repeatable checklist prevents most of them.
Data You Can Open This Week
Three tiers cover most graduate projects.
- ICPSR: A searchable archive with filters for public-use and recent releases. Free account, no special clearance for public files.
- Add Health: The public-use files cover Waves I through VI and are free, but they are a subset of the full sample and leave out friend, sibling, and romantic-partner IDs. The ICPSR version (study 21600, updated March 2026) requires a MyData account and your supervisor's name and contact details. Your institution does not need to be an ICPSR member.
- Census restricted-use microdata: Not public-use. Approved projects go through the Standard Application Process Portal and are carried out in a Federal Statistical Research Data Center or through the Remote Access Program. Terms vary by project, so confirm them for yours.
Census Open Data and other public microdata are the fastest way to practice before applying for restricted access.
Missing Data and Sampling
Listwise deletion is a choice, not a neutral default, and it can bias estimates and shrink power. When data are plausibly missing at random given observed variables, multiple imputation or full-information maximum likelihood are the modern standards. Neither fixes data that are missing not at random, so run sensitivity analyses. Check that your estimator and survey design actually support the method you choose.
Sampling bias comes down to four questions. Who is in the frame? Who responds? Who is administratively invisible, such as people outside the records you are using? And how do weights change your conclusions? Use the dataset's own technical documentation to pick weights, strata, and variance procedures, and compare weighted with unweighted results.
Privacy and Ethics
Secure IRB review or a documented exemption determination before you touch human-subjects data. Read each data use agreement closely, store files only in approved secure environments, and apply small-cell suppression to any table you release. Linked administrative data carries the sharpest re-identification risk, because a rare combination of age, place, and program participation can single out one person.
Pre-Analysis Checklist
- Confirm access route, approvals, and agreement terms.
- Document the sampling frame and the correct weights.
- Describe missingness by pattern and likely mechanism.
- Choose the missing-data method and plan a sensitivity check.
- Set storage and suppression rules before analysis begins.
- Write down your hypotheses before looking at outcomes.
A 2026 study of political science publications from 1995 to 2022 found that 69% of quantitative articles published in 2022 still made no data or code available. Candidates who document and deposit their analysis files stand out in hiring precisely because that step remains uncommon.
AI, Causal Inference, and the Future of Quantitative Training
Eighty-one percent of social scientists surveyed in 2026 said they had tried AI chatbots in their research, and about one in five had handed work to an autonomous coding agent, according to a poll of 1,260 researchers.1 That gap between trying a tool and trusting it frames a debate now unfolding in graduate communities online.
The Thread That Framed the Question
In an r/GradSchool post, an applied mathematics doctoral student writing as u/mr_lemon_head argued that AI "can pretty much end-to-end do any project I might want to undertake as part of my thesis," and asked whether a PhD has "just become a longer masters program." Peers answered from several directions. One called AI "a force multiplier" and said learning fundamentals so you can add value to the process matters more than ever. Another conceded that models "know a lot of math" but are "not great at decision making," producing solutions "incredibly difficult for us to make sense out of," and predicted that the applied mathematician's role becomes "more executive." A third simply advised finding collaborators in other fields who need quantitative expertise.
Where the Models Help, and Where They Do Not
AI is genuinely strong at code scaffolding, data cleaning, and boilerplate modeling. The weakness shows up at defending an identification assumption and at knowing which confounders matter for a given population. The survey numbers fit that split: trial is near-universal, while roughly a quarter of doctoral students and postdocs used coding agents weekly, less than half the rate among tenured researchers.1 Delegating the whole workflow remains rare.
Originality Norms Are Being Rewritten in Public
Program policies diverge. The University at Buffalo's Doctor of Juridical Science program permits AI as an explicit research method, such as text classification, but bars delegating ideas, judgments, analysis, arguments, or interpretations, and requires the student's own prose.3 Arizona State's sociology doctorate prohibits generative AI on comprehensive exams and generally on dissertations, allowing limited writing help only after consulting the chair and committee.4 Cornell adds data governance: institution-approved tools only, and no sensitive or proprietary data in general-purpose chatbots.5 In U.S. STEM dissertations, AI-assisted writing appeared in 29% of 2026 cases, yet fewer than 5% of those graduates disclosed it.2 The defensible claim is shifting accordingly. "I framed a question nobody had framed" survives scrutiny better than "I ran a model nobody had run."
The Training Implication
Learn to audit machine output. Research on doctoral formation describes the change as a shift from production to verification, with students owning accuracy, legitimacy, and defensibility, and with assessment moving toward process and the defense itself.6 The future quantitative role looks more like oversight and interpretation than manual computation.
- 2026 Survey of Social Scientists on AI Use, DPGross
- AI-Generated Writing in U.S. STEM Dissertations, ERIC
- JSD AI Policy, University at Buffalo School of Law
- Sociology Doctoral Program AI Policies, Arizona State University
- Responsible and Ethical Use of AI in Research and Scholarship, Cornell University
- Generative AI and Doctoral Formation, Frontiers
How the Job Market Values Quantitative Social Science Skills
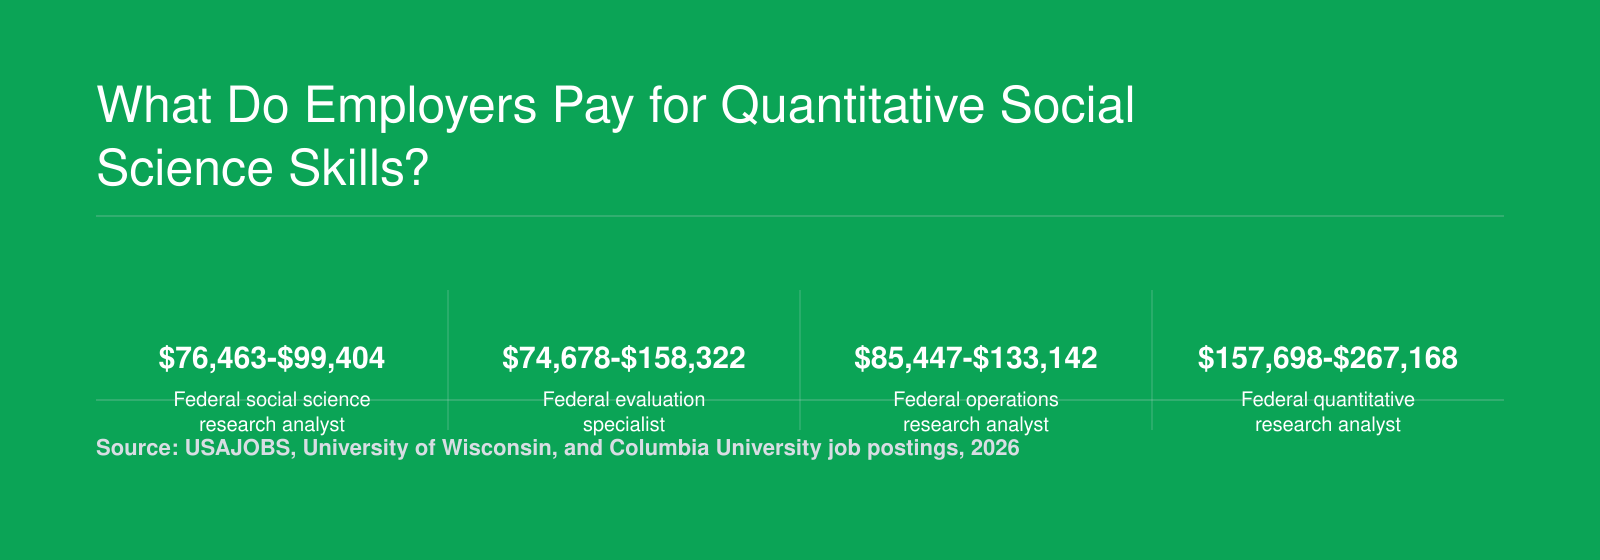
These figures come from 2026 job postings, not a national salary survey, and they span related job families rather than one occupation. Federal roles vary with grade, locality pay, and experience, while university analyst positions tend to start lower. Specialized quantitative research posts reach the top of the range.
- Social Science Research Analyst Job Posting, USAJOBS
- Social Science Research Analyst (CMS) Job Posting, USAJOBS
- Social Science Research Analyst (Evaluation) Job Posting, USAJOBS
- Quantitative Research Analyst Job Posting, USAJOBS
- Operations Research Analyst Job Posting, USAJOBS
- Institutional Policy Analyst Job Posting, University of Wisconsin
- Research Data Analyst I Job Posting, California Department of Justice
- Data Analyst Job Posting, Columbia University
- Junior Research Data Analyst Job Posting, University of Virginia Career Center
- 2026 Social Science Research Jobs, Indeed
Where Does Your Quantitative Background Fit?
Questions to Ask Yourself
- Do you want to build the models, or decide which model answers the question? Modeling work rewards depth in estimation and code. Directing it rewards judgment about design, stakeholders, and interpretation. The two roles diverge in daily work and in how your portfolio should read.
- Do you want a substantive home field such as education, health, or child welfare, or a methods generalist identity? A home field gives you standing to challenge how a question is framed and where collaborators will look for you first. Generalists trade that for wider mobility across teams and sectors.
- Do your target employers hire on credentials, portfolios, or both? Policy shops and research firms often screen on demonstrated analyses, while academic and government postings lean on degree level and coursework. Check real postings before you invest in another credential or another project.
- Can you explain your method choices to someone who does not share your training? Quantitative value in social science is realized in translation: why this design, what it cannot rule out, and what it means for a program or policy. That skill is built through collaboration, not coursework alone.
Career Paths, PhD Fit, and Building a Portfolio That Travels
The real decision is whether a longer credential leads to work you actually want, or merely delays work you could start now with a master's and a strong portfolio.
Four Job Families, Mapped Honestly
- Research and evaluation: Federal agencies and think tanks hire analysts to evaluate programs and report findings publicly. Federal research analyst postings on USAJOBS often ask for three or more years of experience.1 Policy analyst postings may accept a master's degree, two years of graduate education, or a law degree instead.2
- Data and analytics: Nonprofits and government offices need people who can manage administrative or survey databases3, run statistical analyses, and build visualizations in tools like Tableau or Power BI.4
- Academic research staff: Junior research analyst roles typically ask for a master's in a social science or related field, plus working fluency in Stata, R, or Python.5
- Doctoral study: This is the route to faculty work and to roles where you set your own research agenda.
PhD Fit Is About Taste, Not Talent
Ask yourself three questions. Do you want to spend several years on one question? Do you want to teach? Do the jobs you are targeting require the doctorate, or would a master's and experience get you there? Many evaluation and analytics roles fall into the second group. In a recent r/GradSchool thread about AI and the applied math PhD, one commenter said they wished they had been "a bit more strategic" during their doctorate. That regret is common enough to plan against.
What Admissions Committees Look For
Math prerequisites vary more than most applicants expect. Arizona State's Statistics MS lists one semester of calculus and one introductory applied statistics course.6 Illinois expects calculus through multivariable, linear algebra, and calculus-based probability and statistics.7 UC Davis asks for a year of calculus, linear algebra, programming skill, and upper-division math or statistics coursework, and it notes that a math or statistics major is typical but not required.8 Doctoral programs generally ask for more: mathematical statistics, and in math-intensive fields, advanced calculus or real analysis.7 Check each department's list directly.
In your statement of purpose, lead with a substantive question, then name the methods you would bring to it and the faculty whose work fits. Choose recommenders who can speak to your quantitative ability, your persistence, and your writing.
A Portfolio That Travels
- Finished projects: Two or three complete analyses with clean, documented code that runs from raw data to final output.
- Plain-language write-up: A short summary a non-specialist could act on.
- Collaborative work: One joint project where you can state exactly what you contributed.
One caution: a generalist quantitative degree is usually a weaker credential than one tied to a domain such as education, health, or labor policy. Employers hire people who understand both the model and the problem it is meant to solve.
- Research Analyst Job Posting, USAJOBS
- Policy Analyst Job Posting, USAJOBS
- Research Analyst Job Posting, USAJOBS
- Research Analyst Job Posting, USAJOBS
- Junior Research Analyst Job Posting, Apex at College of Wooster
- MS Statistics Program Handbook, Arizona State University
- Statistics Graduate Application Requirements, University of Illinois Urbana-Champaign
- Statistics Graduate Admissions, UC Davis